Lab 1B
Objective
The goal of Lab 1B is to successfully establish Bluetooth communication between our computer and the Artemis Redboard Nano. Using Jupyter Notebook, we expand on a framework enabling Python commands to communicate effectively with the Arduino program on our Artemis.
Prelab
I began by reading this Bluetooth Low Energy (BLE) summary. Following this step, I installed the latest release of Python and Pip. This enabled the installation of venv, a virtual environment, using the command:
python3 -m pip install --user virtualenv
The successful installation of venv allowed for the creation of a virtual environment in our project directory named FastRobots_ble using the command:
python3 -m venv FastRobots_ble
The virtual environment can be enabled using the command:
.\FastRobots_ble\Scripts\activate
And deactivated using the command:
deactivate
Following the successful installation and creation of our virtual environment we are able to install jupyter lab into our virtual environment using the command:
pip install numpy pyyaml colorama nest_asyncio bleak jupyterlab
Which we can then open in our virtual environment using the command:
jupyter lab
With Jupyter lab installed in our virtual environment, we can open and modify the Python files in the provided codebase. By installing AurduinoBLE from the library manager and loading ble_arduino.ino onto the Artemis, we are able to print the board’s MAC address on the serial monitor.
Configruation
To facilitate Bluetooth communication between our computer and microcontroller, we must update artemis_adddress in the provided connections.yaml file with the MAC address provided by the board. Additionally, to minimize the likelihood of accidental connection to a different board, we generate a new UUID using the command:
from uuid import uuid4
uuid4()
We then update the BLE_UUID_TEST_SERVICE in ble_adruino.ino and ble_service in connections.yaml value with the generated value. Before moving forward to the lab-specific tasks, we ensured successful configuration by following the test instructions in demo.ipynb.
Tasks
ECHO
The ECHO command sends a string via Bluetooth to our Artemis board. The Artemis then processes that string and returns a modified version.
Python:
ble.send_command(CMD.ECHO, "HiHello")
Arduino:
case ECHO:

    char char_arr[MAX_MSG_SIZE];

    // Extract the next value from the command string as a character array
    success = robot_cmd.get_next_value(char_arr);
    if (!success)
        return;

    tx_estring_value.clear();
    tx_estring_value.append(char_arr);
    //tx_estring_value.append(" :)");
    tx_characteristic_string.writeValue(tx_estring_value.c_str());

    break;
Python Output:

SEND_THREE_FLOATS
The SEND_THREE_FLOATS command sends 3 floats to the Artemis. The board then extracts the floats from the Bluetooth message and prints them to the serial monitor.
Python:
ble.send_command(CMD.SEND_THREE_FLOATS, "2.3|-6.8|7.5")
Arduino:
case SEND_THREE_FLOATS:
    float float_a, float_b, float_c;

    // Extract the next value from the command string as an integer
    success = robot_cmd.get_next_value(float_a);
    if (!success)
        return;

    // Extract the next value from the command string as an integer
    success = robot_cmd.get_next_value(float_b);
    if (!success)
        return;

    success = robot_cmd.get_next_value(float_c);
    if (!success)
        return;

    Serial.print("Three Floats: ");
    Serial.print(float_a);
    Serial.print(", ");
    Serial.print(float_b);
    Serial.print(", ");
    Serial.println(float_c);

    break;
Serial Output:

GET_TIME_MILLIS
The GET_TIME_MILLIS command prompts the Artemis to get its current time in milliseconds and send it to your computer as a formatted string.
Python:
ble.send_command(CMD.GET_TIME_MILLIS, "")
Arduino:
case GET_TIME_MILLIS:
    tx_estring_value.clear();
    tx_estring_value.append("T:");
    tx_estring_value.append((int)millis());
    tx_characteristic_string.writeValue(tx_estring_value.c_str());

    Serial.print("Time Sent back: ");
    Serial.println(tx_estring_value.c_str());

    break;
Python Output:

Notification Handler
To explore the utilization of notification handlers, we constructed a simple handler that was responsible for extracting just the time from the formatted string returned by the GET_TIME_MILLIS function.
time_data = []
def notification_handle(uuid, byte_arr):
    time = ble.bytearray_to_string(byte_arr)[2:]
    time_data.append(time)

ble.start_notify(ble.uuid['RX_STRING'], notification_handle)
GET_DATA_RATE
To construct a loop that gets time in milliseconds to be sent to and processed by the computer, I created a command called GET_DATA_RATE. This command stores the time and transmits it to the computer via Bluetooth. This happens in a loop that allows me to specify the duration I want to collect and transmit data, which assists in data rate calculation but, more importantly, allows me to check for data loss, which is important for later in the lab. The transmitted data is processed by the notification handler, which places the time data into a list.
Python:
ble.send_command(CMD.GET_DATA_RATE, "")
Arduino:
case GET_DATA_RATE:
    start_time = millis();
    count = 0;

    while(millis() - start_time < 5000){
      tx_estring_value.clear();
      tx_estring_value.append("T:");
      tx_estring_value.append((int)millis());

      tx_characteristic_string.writeValue(tx_estring_value.c_str());
      Serial.println(tx_estring_value.c_str());
      count++;
    }
    Serial.print("Time stamp count:");
    Serial.println(count);
    break;
Serial Output:

In the 5 second transmission window it is able to transmit 151 time stamps. Considering that each time stamp is a 9 byte string, this means a data transmission rate of 271.8 Bytes/s
SEND_TIME_DATA
Rather than collecting and transmitting time data individually, SEND_TIME_DATA populates an array with time data in Arduino. Upon instantiation, we must specify the array size. To prevent overfilling, the array indices are populated in a for loop, which stops iterating once the value corresponding to the last index of the array is reached. Once the array has been populated, it iterates through it, sending each timestamp to the computer. The data is then processed with the same notification handler used to GET_DATA_RATE.
Python:
ble.send_command(CMD.SEND_TIME_DATA, "")
Arduino:
case SEND_TIME_DATA:
    while(stampCount < maxTimeStamps){
      timeStamps[stampCount] = millis();
      stampCount++;
    }
    start_time = millis();
    for(int i = 0; i < maxTimeStamps; i++){
      tx_estring_value.clear();
      tx_estring_value.append("T:");
      tx_estring_value.append((int)timeStamps[i]);

      tx_characteristic_string.writeValue(tx_estring_value.c_str());
    }
    end_time = millis();
    Serial.print("Transmission Time:");
    Serial.println(end_time-start_time);

    break;
Python Output:
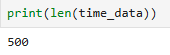
Upon completion of data transmission printing the length of the array, time_data, will return a value of 500 which is to be expected. When comparing the values with those displayed in the serial monitor they are the same.
GET_TEMP_READINGS
GET_TEMP_READINGS works similarly to SEND_TIME_DATA. It includes an additional array of the same size, populated using temperature data. Once the arrays have been populated, they are looped through simultaneously, transmitting temperature data with the timestep at which it was collected, separated by a space. The space enables the split function to be used when parsing the transmitted strings, allowing the data to be placed into two lists easily.
Python:
time_data = []
temp_data = []
def notification_handle(uuid, byte_arr):
    time, temp = ble.bytearray_to_string(byte_arr).split()
    time_data.append(time)
    temp_data.append(temp)

ble.start_notify(ble.uuid['RX_STRING'], notification_handle)

ble.send_command(CMD.GET_TEMP_READINGS, "")
Arduino:
case GET_TEMP_READINGS:
    while(stampCount < maxTimeStamps){
      timeStamps[stampCount] = millis();
      temperatures[stampCount] = getTempDegC();
      stampCount++;
    }
    start_time = millis();
    for(int i = 0; i < maxTimeStamps; i++){
      tx_estring_value.clear();
      tx_estring_value.append((int)timeStamps[i]);
      tx_estring_value.append(" ");
      tx_estring_value.append((int)temperatures[i]);

      tx_characteristic_string.writeValue(tx_estring_value.c_str());
    }
    end_time = millis();
    Serial.print("Transmission Time:");
    Serial.println(end_time-start_time);
Python Output:
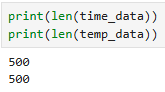 Upon completion of data transmission, printing the length of the two arrays, time_data and temp_data, will return a value of 500 which is to be expected considering that maxTimeStamps = 500. Addtionally, when comparing the time and temperature values with those printed to the serial monitor they do match.
Discussion
The first method allows for seemingly real-time data transfer. The key limitation, however, is that your sampling rate is capped by the speed at which you can transmit data over Bluetooth successfully. In situations where your sampling frequency is much faster than your data transfer rate, you will sampling data much slower than what is possible which may not be important depending on the specific type of sensor data as well as the application.
The second method allows for data collection at a much faster rate. However, that data can not be transmitted and utilized until the arrays they are being in stored have been populated. With this approach, you lose out on the speed at which you receive the data over Bluetooth, but the data you receive has the potential to be higher fidelity, depending on the sensor sampling rate. Additionally, this method is limited by the board's RAM. In the first method, there is not enough data being stored to prompt concerns over memory; however, with limitations on the board's RAM, if you are not thoughtful about your store and send approach, you have the potential to run out of memory. Assuming that data is 32-bit (4 bytes) and that memory is not being used for anything else (which is not the case), we can store 96,000 data points before running out of memory.
Additional task for 5000-level students
Effective Data and Overhead
import matplotlib.pyplot as plt
import numpy as np

data_rates = []
send_time = 0
receive_time = 0
for i in range(5,121,5):
    send_time = time.time()
    ble.send_command(CMD.ECHO, (" " * i).encode("utf-8"))
    ble.receive_string(ble.uuid['RX_STRING'])
    receive_time = time.time()
    data_rates.append(i/(receive_time - send_time))


packet_sizes = np.arange(5, 121, 5)
plt.figure(figsize=(8, 5))
plt.plot(packet_sizes, data_rates)

plt.xlabel("Packet Size (bytes)")
plt.ylabel("Data Rate (bytes/sec)")
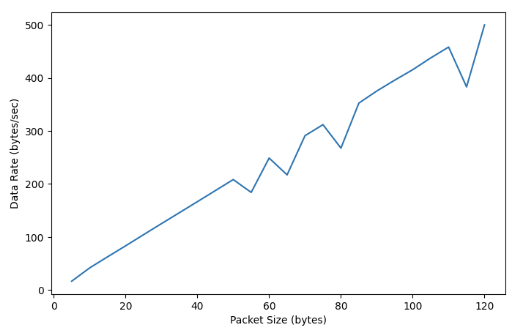 Larger sized packets reduce overhead becuase as we can see in the plot, as packet size grows, data rate increases.
Reliability When data is being sent a a higher rate to the computer the computer is able to read all the data that is published. In the GET_DATA_RATE command the Artemis is trying to send time data as fast as possible to the computer and we observe thta all the data that is sent is recived indicating that despite rate, there is no data loss.
Refrences
I received help from Annabel Lian for the creation of my effective data rate and overhead graph